Analysis & reporting · In production
Toprak Analiz
An application that computes soil analysis results, interprets them, and checks them for consistency.
In soil analysis a raw measurement says nothing on its own. An absorbance reading passes through a calibration curve, becomes a concentration once sample mass and dilution are applied, and finally lands on a scale such as “low / adequate / high”. Every link in that chain can go quietly wrong when it is done in a spreadsheet.
The application runs the whole chain and records each step: which standard series was used, whether the curve’s R² was within limits, and which interpretation scale was applied.
Why it exists
This one grew out of a concrete incident: a spreadsheet error once inflated the potassium results of a batch of samples by a factor of thousands, and it was only caught afterwards. Moving the calculation into the application keeps that kind of error from staying silent — an inconsistent result is now flagged before it is reported.
What it does
Batches & samples
Grouping samples into batches, with sample header data pulled from the central system.
Standard series
The calibration series belongs to the batch, and the curve’s R² is checked against an acceptance limit.
Calculation & interpretation
Concentration calculation, and placing the result on published interpretation scales.
Consistency checks
Rules that catch result combinations which cannot chemically coexist.
Finalisation
Finalising a batch locks the record; every later intervention is written to a log.
Reporting
A printable report with the result table and the interpretation.
On screen
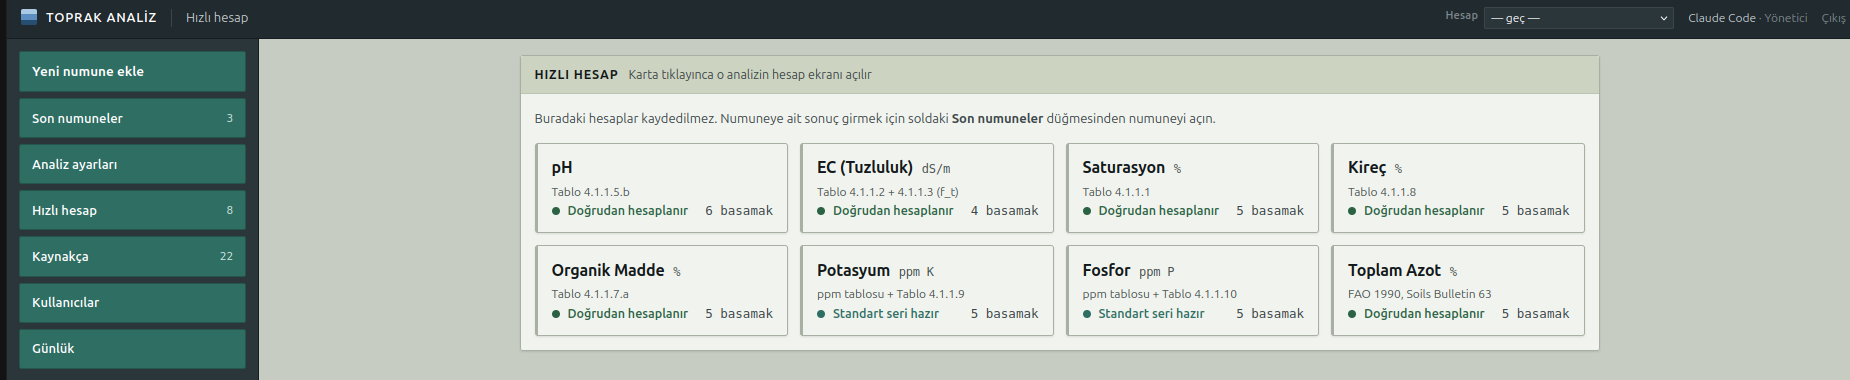
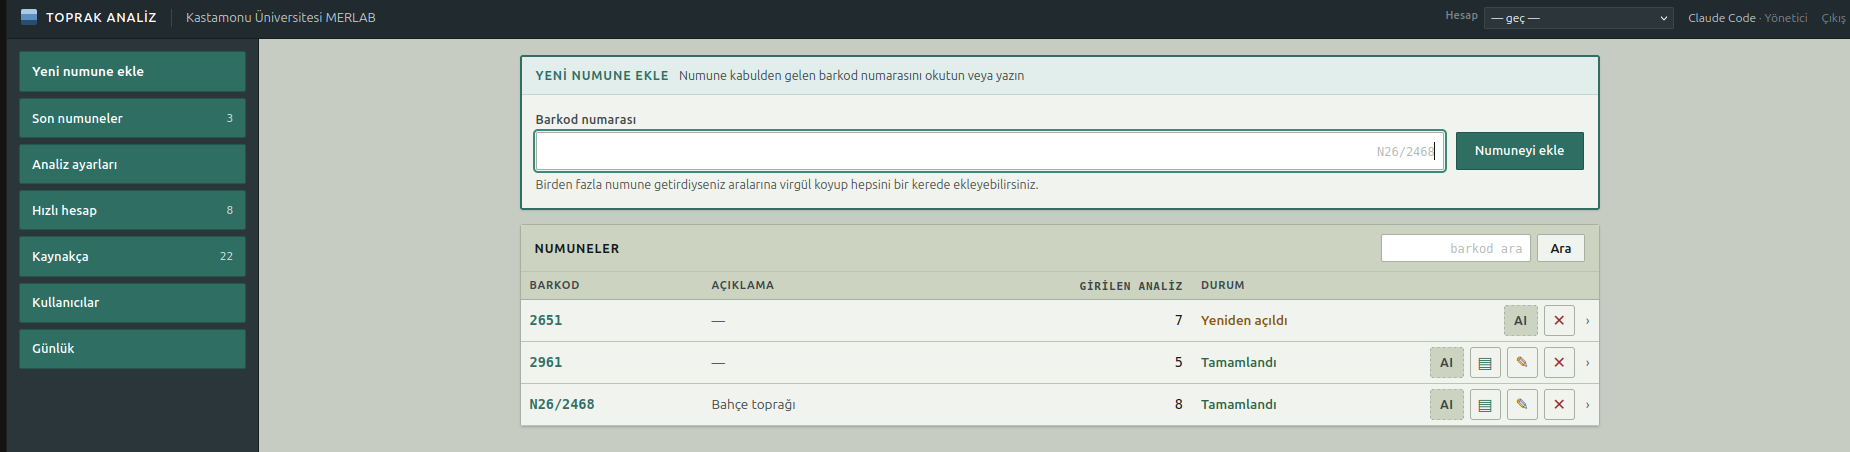
Screenshots are from the live systems. Where something has been left out, the caption says so.
Under the hood
- Sample header data is pulled from the central system through a narrow endpoint; the application has no direct access to that database.
- Interpretation scales are stored together with their source, so every threshold is traceable to a reference.
- One scale absent from the literature was derived from historical records and cross-checked against an independent source.
- Three permission levels: manage, record, and view only.